Tools and experiments: bookmarks heatmap
Last changed on
A new experiment is available: the galaxy bookmark 3D heatmap.
The name is a little bit of a mouthful, but that's what it is:
- It's a heatmap :-)
- It's in three dimensions :-)
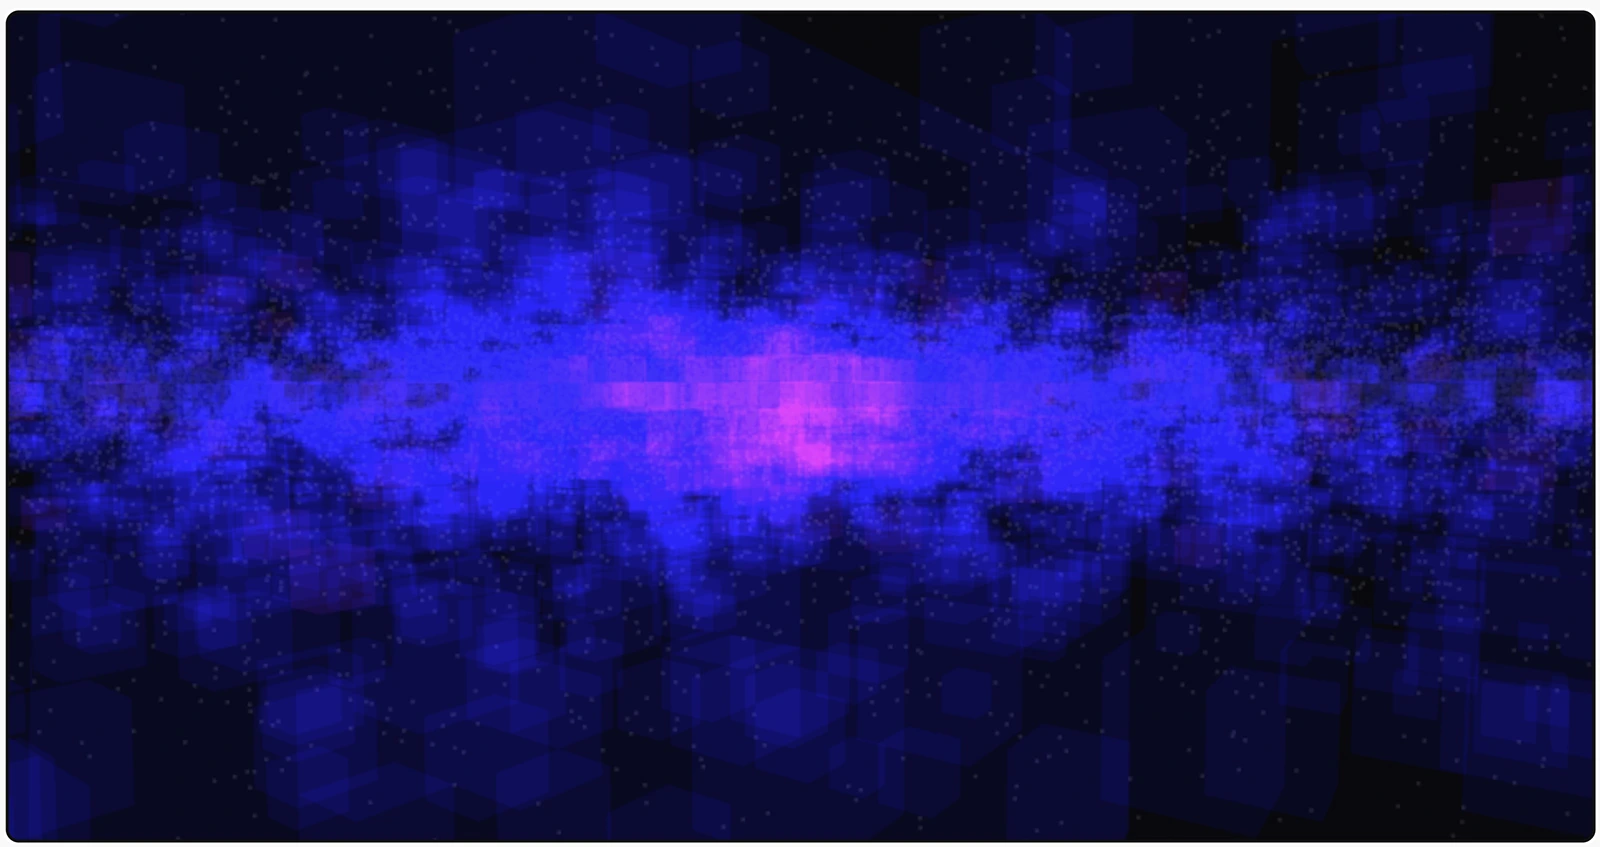
I think it is quite pretty because of its Cyberpunk looks. I don't know about you, but it reminds of the mind pictures I had of the pre-2021 "Cyberspace" (if you know the RPG lore a little bit…). It's also somewhat reminiscent of some Cyberpunk 2077 scenes while in the matrix/cyberspace/networld in the company of Johnny Silverhand. I think?
And no, it is not inspired by this extremely famous CubeCraft game based on cubes/voxels. Nothing to do with it. :-) Cubes are an inherent part of the galaxy building process, but not because of/after it.
How it works
First of all, a little disclaimer: the Govon galaxy has had several test bookmarks inserted in it (a few thousands). The reason for this is that I do not currently have enough bookmarks by real users to display anything significant. The best way to make me undo such a horror is to register, go to the 3D explorer, navigate and bookmark places!
The SQL query
It is quite simple. If you remember the brief explanation on bookmarks, then all it takes is an SQL aggregation, like so:
 SELECT
 FLOOR(bookmark.x / 10) AS cube_x,
 FLOOR(bookmark.y / 10) AS cube_y,
 FLOOR(bookmark.z / 10) AS cube_z,
 COUNT(id) AS count
 FROM bookmark
 WHERE bookmark.galaxy_id=123
 GROUP BY cube_x, cube_y, cube_z
 ORDER BY cube_x, cube_y, cube_z;
Which, if I am correct, returns a list of lists exposed to the client:
| Index | Data |
|---|---|
| 0 | Cube X |
| 1 | Cube Y |
| 2 | Cube Z |
| 3 | Number of boomarks in cube |
Based on local tests, the performance remains acceptable for a galaxy-wide aggregation for around 10 million bookmarks. Which I am far from having, unfortunately. In case such an event happens, then I can start thinking about streaming partial content, etc. All in due time.
I wonder if this is doable with the rotation of bookmarks… mmmm…
The rendering
This is done using a BabylonJS SolidParticleSystem. I could probably have used thin instances, which I shall maybe try, but I am not even sure the performance would be that different.
Each particle is a cube (duh) and rendered with a low alpha transparency to let the stuff behind bleed through. The heatmaps aspect is covered by having a scale from full blue (rgb(0., 0., 1.)) for 1 bookmark all the way up to full red (rgb(1., 0., 0.)) for 10 bookmarks or more. To be honest, I initially wasn't sure at all about such a colour range and thought that it would look clunky and quite flashy, but it turned out to be quite nice-looking.
Useful for other subsequent ideas
The usefulness of such a tool in itself is debatable. However, it is useful to start playing with visualisation possibilities for dynamic volumetric data in a galaxy. For example:
- Displaying the number of ships/units/stations per cube, with regular updates
- Displaying zones of influence and/or control of factions or alliances
- Displaying intensities/frequencies for various activities and/or events: mining, research, ground or space conflict… anything handled by the space engine
Of course, in such cases, a cubic display would not be 100% appropriate. Perhaps a more dynamic mesh building and merging could happen client-side. This is undecided at this stage, but the bookmark heatmap opens up opportunities for more useful ingame displays that could be always on or toggable.
Please signin to add your comment.